Visualizing a Decade of Change in the Built Environment
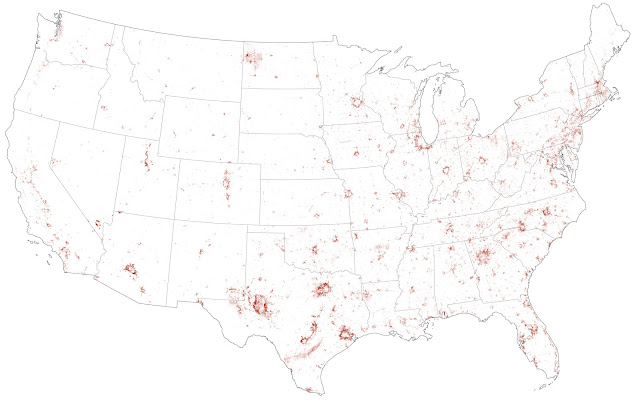
The movement of shadows is noticeable over the course of a day. Seasonal change is visible over a few months. However, urban scale change takes many years or decades to see the impact of new construction. The map above visualizes the newly developed land over the past decade. Often it is hard to comprehend just how much the city or town we live in evolves over time because of the slow pace of development. That is what makes the map and the images in articles like this, so fascinating. By stitching together before and after images over 10 years, it visualizes just how much some areas of the country have transformed over the past decade.
I encourage you to click the link to the article and scroll through the various topics that discuss themes of the decade of transformation in america.
Change can seem slow. A new building rises, one floor at a time. A new subdivision breaks ground with two homes, and then four. A new transit line is planned, and years pass. What it all adds up to can be hard to see.- A Decade of Urban Transformation, Seen From Above
One quick takeaway is how these transformations are related to our growing climate crisis. You can see green yards and pools pop up in the dessert, farmland scraped clean for suburban sprawl, and giant data centers replace forest. Most of this development is making matters worse and not the sort of development we need to see in order to combat climate change.
At least some of the image show densification of urban areas, replacing parking lots with new housing, and some infrastructure, like the Tilikum Crossing in Portland, that is dedicated to public transit hopefully helping us more away from car-centric lifestyles. Let's hope that more of this sort of change is what we see in the decade to come.
---
We are posting new content to our blog at Lucas Gray Design.
If you are interested in hiring us for design services contact us here.
If you would like to build an ADU purchase plans from Modern ADU Plans


